Synteny plots
Introduction
Our website provides dynamically generated synteny plots. Synteny plots are useful for visualising the gene content and order conservation following the duplication of entire chromosomes or chromosomal segments. The chromosomes resulting from a whole genome duplication event will initially have the same gene content and order, however, given evolutionary time, chromosomal segments will be rearranged and these patterns will become scrambled. Despite this, we can identify syntenic segments dating back to the 1R and 2R WGD events in present genomes - these can be seen using our synteny plots.
Synteny settings
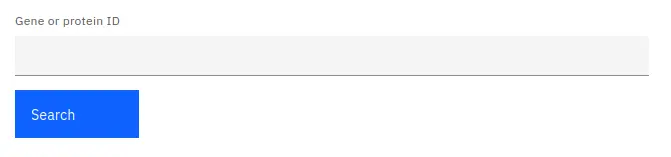
In order to display a synteny plot, you must enter the gene or protein identifier of interest into the provided textbox and press the search button. This will match the identifier against our database and attempt to find all the synteny blocks that it appears in. Clicking the synteny link beside the protein identifier on tables across our website will also display the relevant synteny plot.
If any matching synteny blocks are found they will be displayed below. If multiple blocks are found, a pagination menu will be shown below the plot, allowing the user to switch between synteny blocks.
Reading the plot
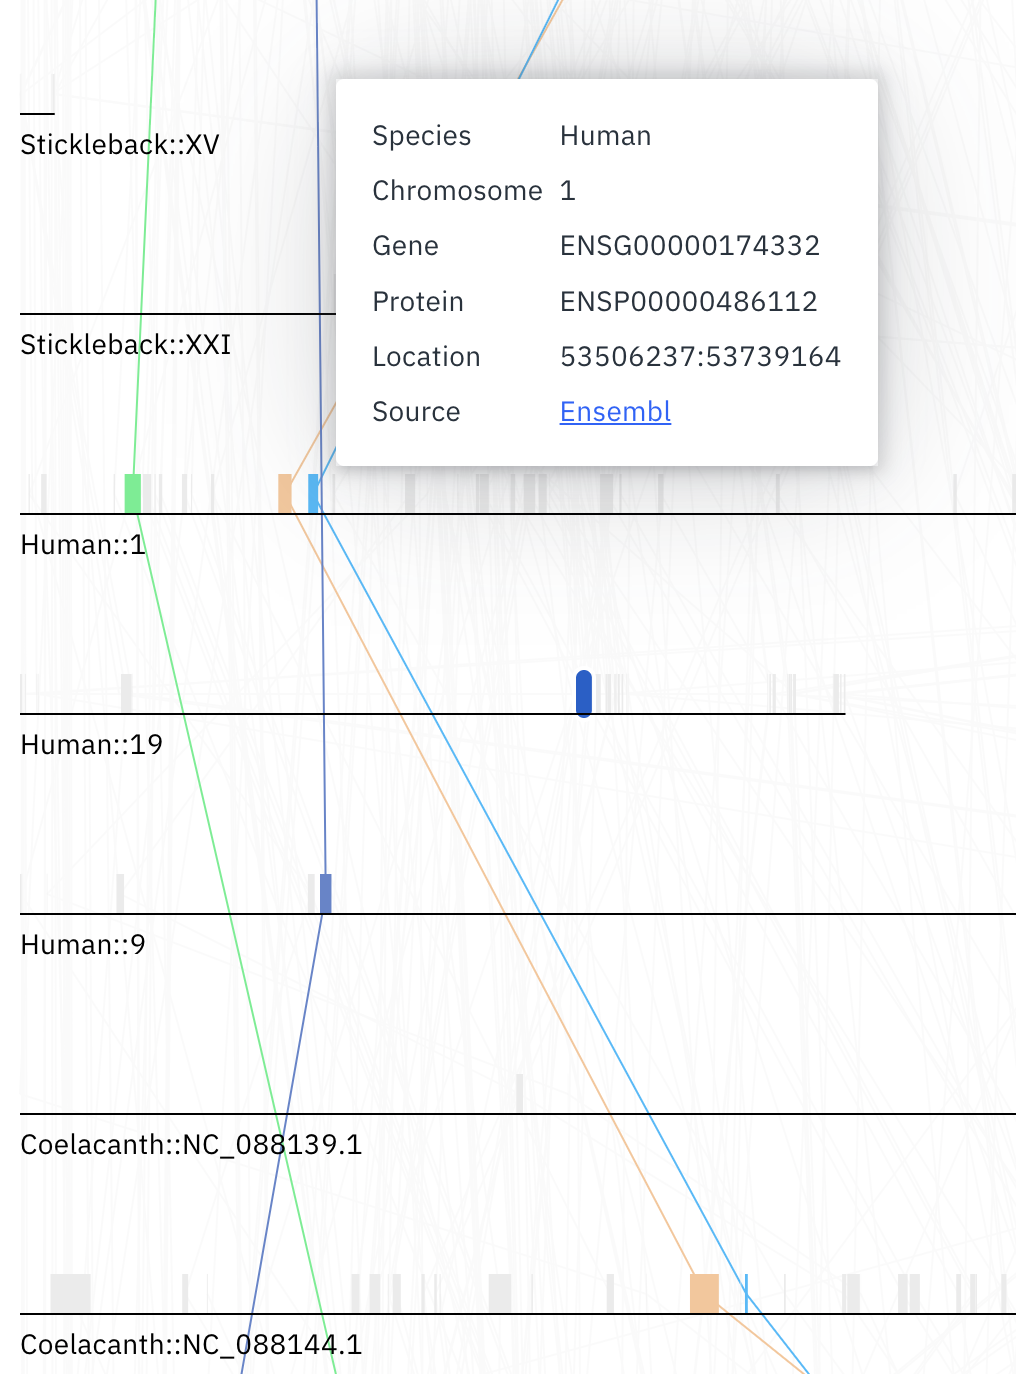
The plot shows all the chromosomes across species in the current synteny block, represented by dark grey horizontal lines. Grey boxes on top of each chromosome represent genes. Light grey lines connect genes on different chromosomes, denoting homologous relationships between genes.
Hovering the mouse cursor over any gene will display additional information about it, including a link to the genome database from which it was sourced.
Any genes in the current selection (as well as their homologous relationships) will be highlighted. Genes can be added to the selection using the table below. This selection can also be cleared by pressing the cancel button on top of the table - you can read more about selection here. Alternatively, clicking on any gene on the plot will also add it to the current selection.
Multiple selection mode can be enabled by pressing the ‘s’ key. This will change the mouse cursor to a crosshair. In this mode, you can select multiple genes at once by clicking and holding the left mouse button anywhere on the plot and moving it to draw a selection area. Releasing the mouse button will select any genes that fall within the selection area and exit multiple selection mode. Alternatively, multiple selection mode can be cancelled at any time by pressing the ‘esc’ key.
The plot can be panned by holding the left mouse button and moving the mouse. The plot can also be resized using the scrollwheel.
Data table
All genes belonging to the synteny block will be shown in a table below the synteny plot. The table displayed on this page follows our standard layout, you can read more about it here.
Data download
Gene data used for generating the current plot can be selected and downloaded. You can read more about selecting table entries here.
Linking
You can view more information about a gene by clicking on any of the entries listed under the source table column.
You can also jump to the gene tree or synteny data visualisations containing any particular gene entry by clicking any of the links in the protein column. You can read more about data linking here.