Gene phylogenies
Introduction
Our website provides dynamically-generated gene trees. Gene trees are useful for visualising the evolutionary history of a gene and all of its homologs. Given that whole genome duplications create additional copies of every gene in the genome, we expect to see see one or more bifurcations (depending on the number of WGDs) in any given WGD tree where genes on either side of this node are ohnologous, related by the WGD event.
Tree settings
In order to display a gene tree, you must first select which tree/orthogroup you wish to plot. This can be done by entering a gene or protein identifier into the provided textbox and pressing the search button. This will match the identifier against our database and attempt to find the gene tree that it belongs to.

Alternatively, selecting the tree link beside any protein identifier across the tables on our website will link to the tree page and display the relevant gene tree.
Reading the tree
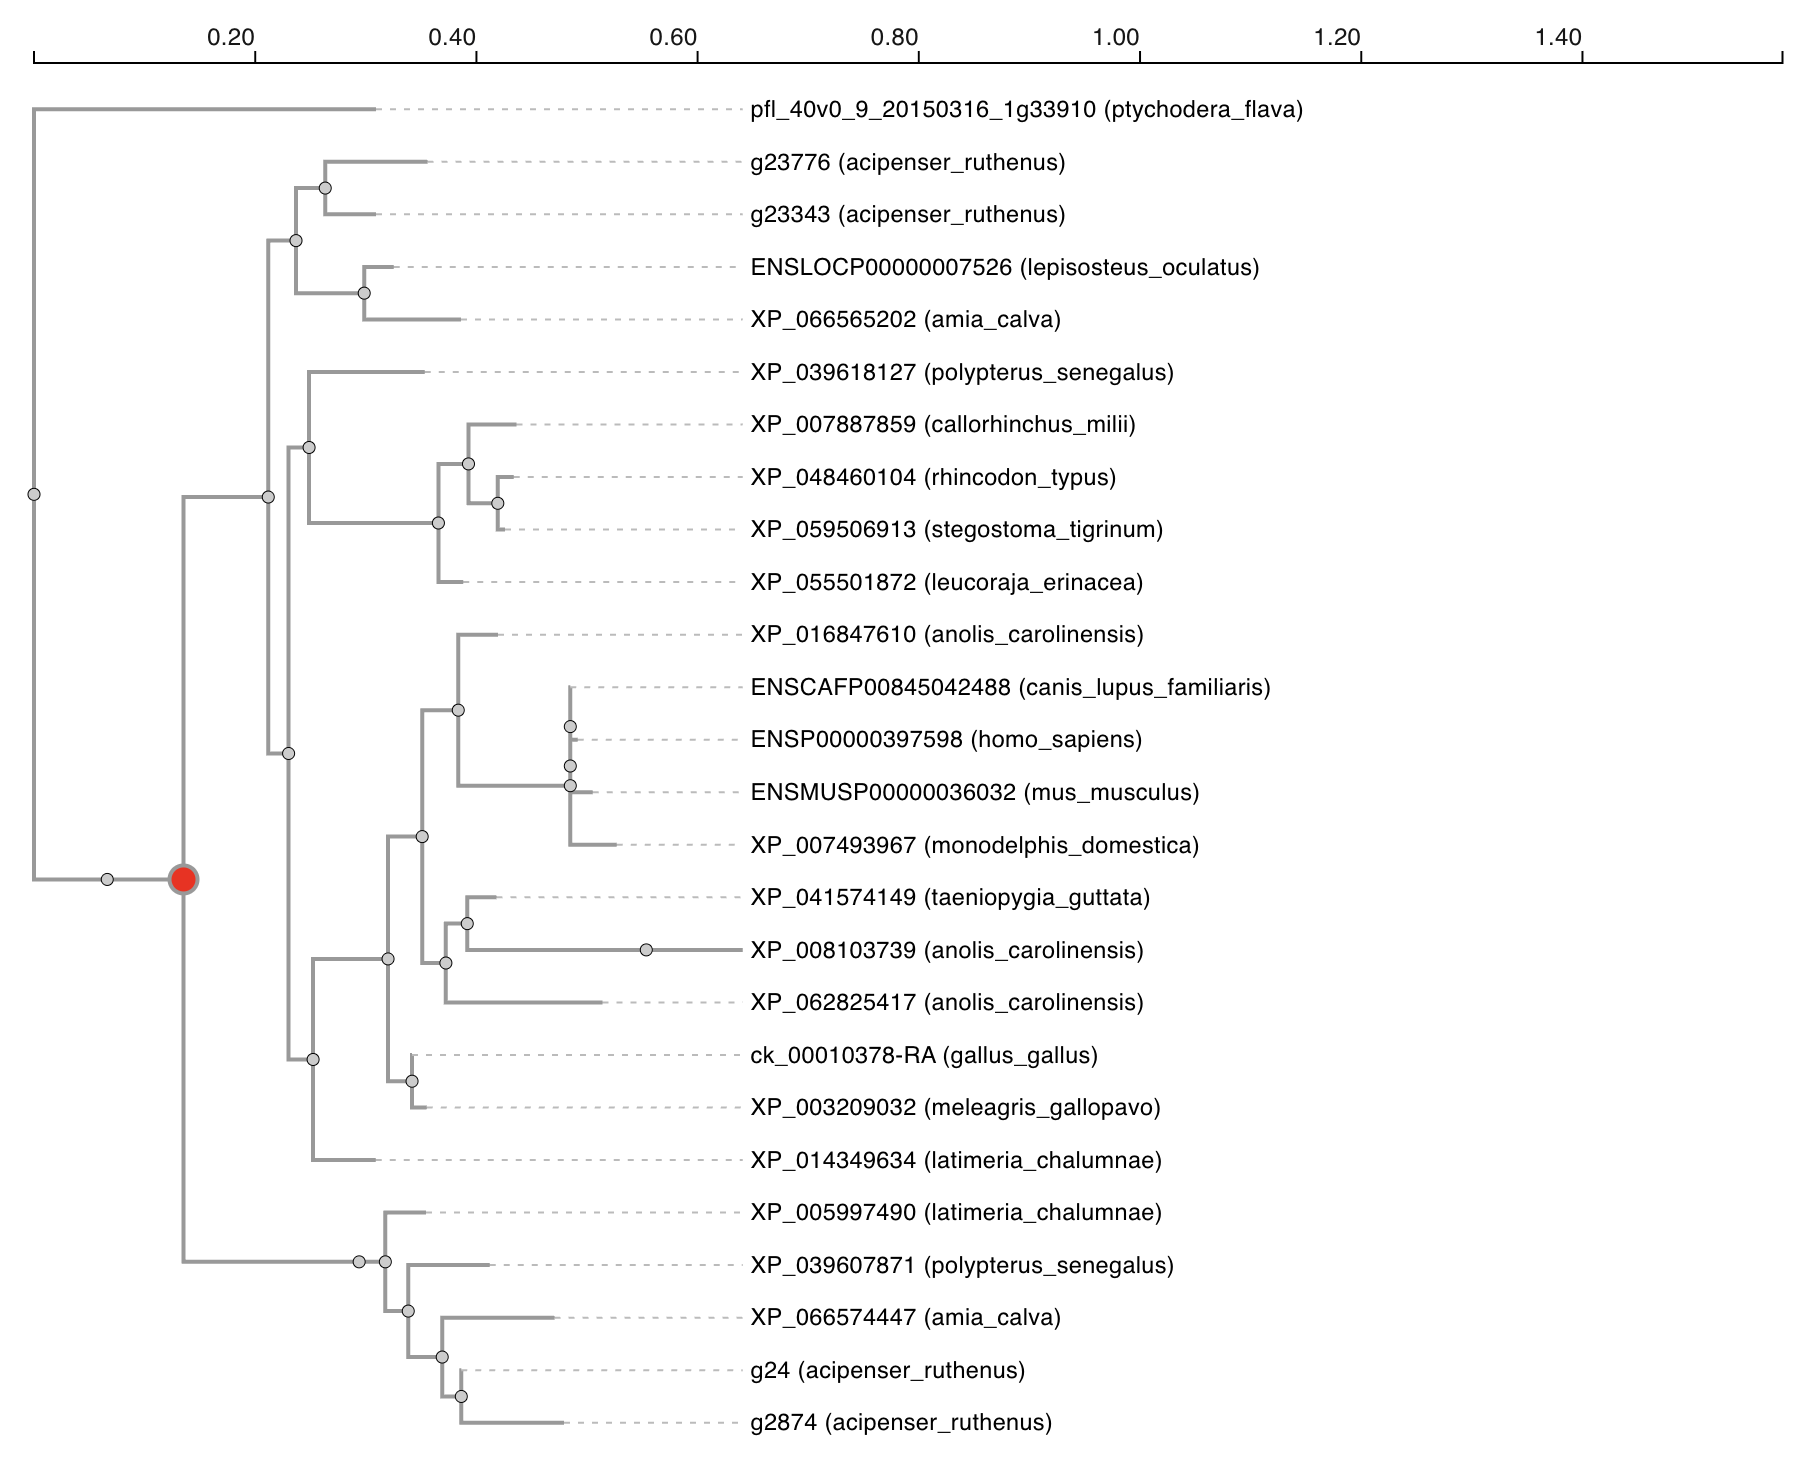
The tree shows the evolutionary history of all genes in the displayed orthogroup. Each tree is rooted on an outgroup. Whole genome duplication nodes are highlighten in red. Leaf nodes are labelled with the species and protein identifier.
Data table
All genes belonging to the displayed tree/orthogroup will be shown in a table below the tree. The table displayed on this page follows our standard layout, you can read more about it here.
Data download
Gene data used for generating the current plot can be selected and downloaded. You can read more about selecting table entries here.
Linking
You can view more information about a gene by clicking on any of the entries listed under the source table column.
You can also jump to the gene tree or synteny data visualisations containing any particular gene entry by clicking any of the links in the protein column. You can read more about data linking here.