Ohnologs database documentation
Introduction
There is a general lack of easily accessible, high-quality vertebrate ohnolog databases - while several datasets exist, they are either poorly documented, or lack (in our opinion) crucial data filtering and visualisation features. We aim to offer a service that attempts to address the shortcomings of current alternatives:
- Multiple sources of evidence (macro-synteny, micro-synteny, and gene trees) are used to classify genes as ohnologs.
- We distinguish between 1R and 2R duplicate pairs.
- We offer multiple ways to filter and select genes from our dataset.
- Users can browse our data before downloading using our online interface.
- We offer multiple ways to visualise and analyse our dataset.
- Our pipeline is well documented, freely available, and reproducible.
Our database currently includes ohnologs originating from the 1R and 2R whole genome duplications, those shared by all jawed vertebrates. We aim to expand our dataset to include ohnologs originating from other vertebrate whole genome duplications in the future.
Features
The features available on our website are summarised below. Each feature is documented more thoroughly on its dedicated docs page.
Download our data
If you want to download our entire dataset, click here.
Alternatively, you can browse to our gene page and select data to download. You can also select data to download from tables across the pages on our website described below.
Search our data
If you already have some genes of interest and want to search our database with those in mind, you can do so by browsing to one of the following pages:
Visualise our data
If you want to visualise the data that you have selected, be that single genes or entire genomes, you can generate figures in real time on the following pages:
- Circos page - docs | website
- Dotplot page - docs | website
- Phylogeny page - docs | website
- Microsynteny page - docs | website
Use cases
The tools provided on our website can be useful for data-exploration and simple analyses. Below is a (far from exhaustive) list of problems that our website can solve:
I have a favourite gene
You can visit the BLAST page to find homologs of your favourite gene that are present in our database. The resulting genes can either be downloaded or selected. Any genes that are currently in your selection will be highlighted across all plots on our website.
I’m interested in a specific gene family
You can visit the selection page and provide a FASTA, TSV or CSV file which includes genes in this family to find if these genes are present in our database. This can be useful for identifying if your genes of interest are 1R/2R ohnologs and as such making inferences about their evolutionary history. The results can either be downloaded or selected. Any genes that are currently in your selection will be highlighted across all plots on our website.
I like pretty graphs
You’re in luck! You can visit any of the circos, dotplot, tree, or synteny pages and (hopefully) enjoy what you see ;). If you’re still not satisfied, let us know what we can do to satiate your immeasurable hunger for pretty graphs.
Our data
The genes in our dataset are displayed using a combination of tables and figures. Below is a summary of the various ways that users can view and interact with our data.
Tables
Most of the pages on our website contain data tables which are located towards the bottom of each page. These tables display all the genes in our database that match your selected filters, or in the case of figures, the table displays all of the genes that appear in a figure.
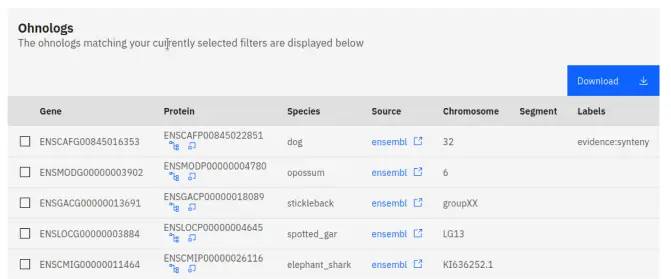
Most tables contain the following information for each gene:
- Gene: The gene identifier.
- Protein: The protein identifier.
- Species: The species whose genome this gene belongs to.
- Source: The database from which the genome was sourced.
- Chromosome: The chromosome that the gene belongs to.
- Segment: The macro-synteny segment that the gene belongs to.
- PGC: The proto-gnathostome chromosome from which the gene originated.
- Labels: The evidence that suggests that this gene is an ohnolog.
Linking
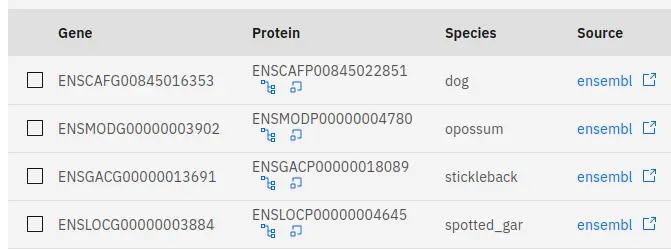
The tables on our website contain links to external databases that can help you to find more in-depth information regarding the genes that you are interested in. These links can be found under the source heading of tables, which are located towards the bottom of a page. These lead to gene entries in external databases such as Ensembl.
In addition to this, there are two internal links in each table under the protein heading. These links will lead you to the gene tree and synteny pages within our website - a quick way to get more information about a gene that might interest you. When jumping to these pages, any selection you may have made on the current page will persist to the target page.
Filtering and selection
Our filtering utilities allow users to display a specific subset of our database based on certain criteria. These criteria can be gene attributes - such as the chromosome that a gene belongs to. Data filtering can be done on the gene and species pages using dropdown menus to specify data attributes that you wish to keep. Alternatively, data can be filtered to include only specific gene/protein identifiers or similar protein sequences using our selection and BLAST utilities respectively. Once filters have been applied, any data that passes these filters will be displayed in a table at the bottom of the relevant page.
Our website allows users to select data displayed in tables - it is a form of manual filtering and curration. However, unlike filtering, your selection is global - it persists across all pages - and any genes currently in your selection are highlighted in all the figures generated by our website. Genes can be added to or removed from the selection using the toggles on the left side of a table.
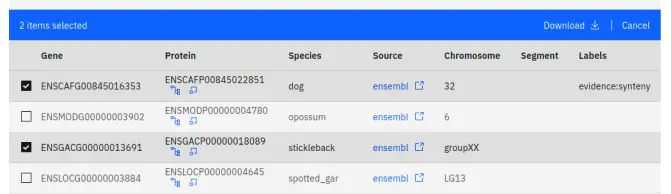
You may find selection useful if:
- You are interested in a specific subset of genes.
- You have applied some filters, and want the filtered genes to be highlighted in figures.
Visualisation
The final way that our data is displayed (and can be interacted with) is through multiple figures generated in real time on our website. These include circos plots, dotplots, gene trees, and synteny plots. Each figure can iteract with the global gene selection:
- Genes that are selected will be highlighted in figures.
- There are multiple utilities that allow users to visually add/remove genes to/from the selection by interacting with each figure.
More details regarding the specifics of visual selection can be found on the individual documentation pages for each figure.
Useful terms
Below are some key terms that are useful to know when navigating the website:
- Whole genome duplication (WGD): A major evolutionary event whereby all genomic material is doubled.
- Ohnologs: Duplicates arising as a result of a whole genome duplication event.
- 1R and 2R: The first and second round of whole genome duplication events that occured in early vertebrates. 1R occured in the vertebrate ancestor, with jawed and jawless vertebrates each experiencing their own 2R event after divergence.
- Microsynteny: Conservation of gene content and order.
- Macro-synteny: Conservation of gene content.
Our pipeline
An in-depth description of our pipeline for curation of our jawed vertebrate ohnolog dataset is available in our paper (placeholder link).
In summary, our pipeline works as follows:
- We obtain genomes from various sources including NCBI RefSeq, Ensembl and GitHub.
- We identify orthogroups and carry out a similarity search using OrthoFinder.
- We quality control sequence alignments, and build ortholog sets using the similarity search output.
- We identify paralogs with duplication timings coinciding with the 1R and 2R whole genome duplications, as input for our ancestral reconstructions.
- We use our bayesian segmentation algorithm to identify segments of conserved macro-synteny across genomes, and we use our reconstruction algorithm to reconstruct the ancestral vertebrate and ancestral jawed vertebrate genomes, which allow us to identify chromosomal rearrangements between 1R and 2R and following 2R.
- We build gene trees, and combine their topology information with information on ancestral chromosome relationships to label 1R and 2R nodes and as such identify the 1R vs 2R origin of ohnologs. Trees with minimal gene loss can be labelled based on topology alone. This information is used to understand which ancestral jawed vertebrate chromosome pairs support 1R vs 2R relationships, information which then allows us to label trees with more extensive gene loss.
- We incorperate microsynteny information to label additional genes as ohnologs.